

Let’s get the 8th grade math out of the way early. If you start with 100 and decrease it 50%, you get 50. But if you increase that by 50%, you only go up to 75. That’s because 50% is not a set quantity, it’s a fraction of some other quantity. Going down 50% and then going up 50% is not a round trip and it doesn’t bring you back to where you started, because the first 50% (the drop) is bigger than the second 50% (the increase).
That’s the end of the math. It wasn’t so bad, was it? In fact, it’s pretty simple. Nevertheless, many readers of financial news and viewers of charts fail to take this simple “baseline effect” into account. Any analysis that looks at a percentage rate of change must take account of the possibility that some very low or high baseline from which the change happens can make the change look artificially low or high.
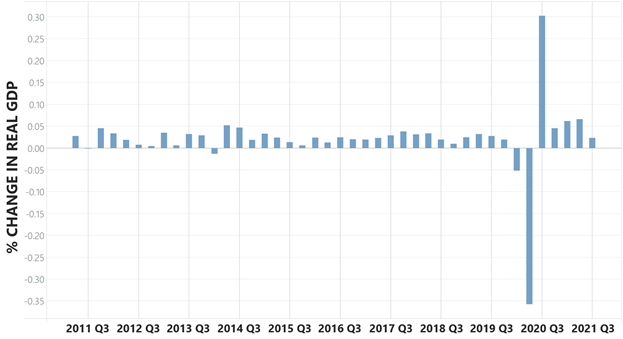
For a real-world example: In the second quarter of 2020, the U.S. economy (as measured by gross domestic product or GDP) contracted by about 1/3. Then it expanded by about 1/3, but as we know, that did not mean it returned to normal. If one looks at a percentage change chart, though, it does look like a round trip.
One way to deal with that problem is to use the actual dollar change in GDP. In other words, current GDP minus the old GDP (which typically means going back either one quarter or one year). Here’s what that looks like:
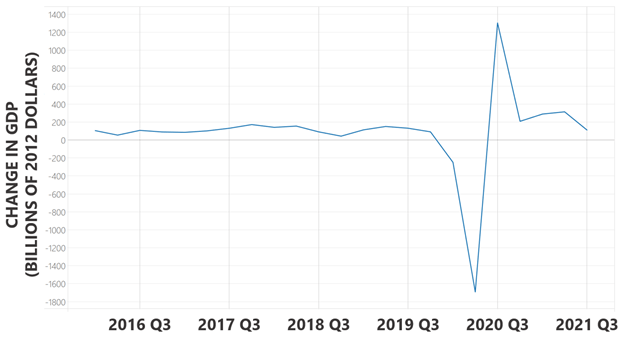
We can see that, although the percent change chart makes the collapse and recovery look symmetrical, the actual dollar change shows that they are not. The return to the previous level of output takes considerably longer. So, new growth didn’t really start until Q3 2020. And since then, growth has not been very strong.
In other words, once we take baseline effects out of the picture and the “easy” growth of a simple return to normal out of the picture, we see an economy that is fairly stagnant. And that stagnation started before any monetary tightening or anything more than minor tapering of the rate at which the Federal Reserve is buying bonds to keep interest rates artificially low. Imagine what would happen if, instead of very gently slowing the rate of monetary stimulus, it actually reversed the new money flow, and instead of tapping the breaks on bond buying, it actually put quantitative easing1 into reverse gear and sold bonds instead of buying them.
From now on, growth will have to be earned, there are no more assists coming from baseline effects. Ditto for earnings: they’ll have to be earned as well.
1 Quantitative easing (QE) is a form of monetary policy used by central banks as a method of quickly increasing the domestic money supply and spurring economic activity.
The opinions expressed herein are those of Vident Financial at the time of publication and are subject to change. This document does not constitute advice or a recommendation or offer to sell or a solicitation to deal in any security or financial product. It is provided for information purposes only and on the understanding that the recipient has sufficient knowledge and experience to be able to understand and make their own evaluation of the information described herein, any risks associated therewith and any related legal, tax, accounting or other material considerations. Recipients should not rely on this material in making any future investment decision.
Investors cannot invest directly in an index. Indexes are not managed and do not reflect management fees and transaction costs that are associated with some investments. Past performance does not guarantee future results.